LinkedIn Carousel Statistics 2026: 27 Data Points Every B2B Marketer Should Know

In the past three months, three major reports landed on LinkedIn. Socialinsider analyzed 1.3 million posts. Richard van der Blom tracked 1.8 million. Postunreel measured engagement across 52 million. They disagree on a lot, but they all agree on one thing: document carousels are the only format on LinkedIn whose performance is still going up.
This article is not opinion. Every number below has a verified source link. If a stat does not match what you have heard elsewhere, that is because the studies use different sample sizes and methodologies, and we cite the original report each time so you can check.
Use these 27 data points to plan your Q2 2026 content, justify carousel investment to a stakeholder, or build a sharper hook for your next post.
The headline numbers
Before the deep dive, here are the four stats that summarize what changed on LinkedIn between 2025 and 2026.
Current organic post reach for individual creators (down from 15-20% in 2024)
Source: Algorithm InSights, Richard van der BlomThe story those four numbers tell: organic reach on LinkedIn is shrinking for almost every format, except carousels, where engagement is climbing in absolute terms while the rest of the platform contracts.
LinkedIn audience and reach in 2026
The audience is bigger than ever. The reach you can actually capture is smaller than ever. Both things are true at the same time.
1. LinkedIn passed 1.3 billion total members in December 2025, with 257 million in the United States, 161.5 million in India, and 83.2 million in Brazil. (DemandSage)
2. 310 million users open the platform every month, and 134.5 million log in every single day. (DemandSage)
3. LinkedIn revenue hit $17.81 billion in fiscal year 2025, a 9% increase over the previous year. The platform is investing heavily in feed quality, which is part of why distribution rules became stricter. (DemandSage)
4. Average post reach for individual creators fell from 15-20% to 8-12% of followers between 2024 and 2026. The drop has been most severe for accounts with more than 10,000 followers, where the algorithm now competes harder against your own backlog of posts. (Algorithm InSights, Richard van der Blom)
5. Company page reach is down to roughly 1.6% of followers, compared with 7% in 2021. Organic company posts now make up 1 to 2% of the LinkedIn feed. If you run a brand page without paid amplification, you are reaching a single-digit share of your own audience. (DowSocial summary of van der Blom)
The takeaway: the pool got bigger, the pipe got narrower. The only way to win in 2026 is to use a format the algorithm still distributes.
Why carousels keep winning while the rest declines
Of every LinkedIn format tracked across the major 2026 reports, only one is still gaining engagement. Carousels.
More interactions than static images, despite images being posted 6x more often
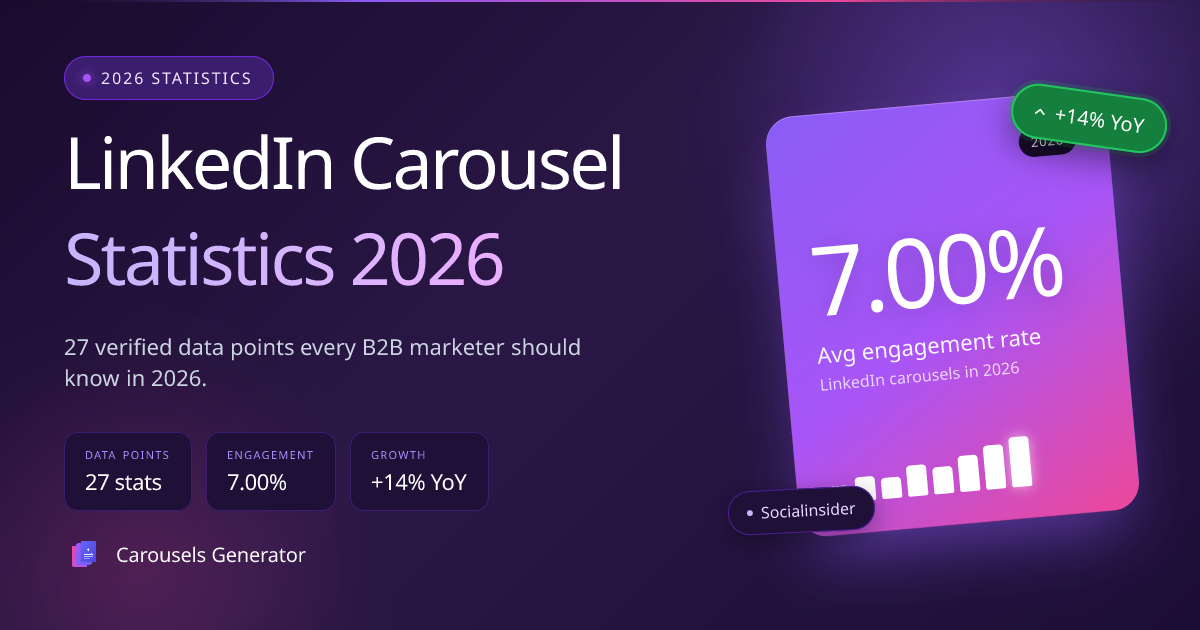
Source: Marketing4eCommerce6. Document carousels score 7.00% average engagement vs. 5.20% across all LinkedIn post types. That is roughly 35% above the platform baseline, and the gap widened by 14% year-over-year. (Socialinsider 2026 Benchmarks Report)
7. Carousels generate 596% more engagement than text-only posts and 278% more than native video. Static images, despite being the most posted format on LinkedIn, sit at 0.74% engagement, more than 9x lower than carousels. (Postunreel)
8. Multi-image posts (carousels and photo albums) get 3.4x more reach and 2.1x more engagement than single-image posts. This is the closest format to carousels on the engagement leaderboard, but document carousels still beat them. (usevisuals)
9. Native video views dropped 36% year-over-year on LinkedIn. The only video formats that bucked the trend were lighthearted clips and repurposed live sessions. Long-form B2B video is no longer a reliable distribution play. (Socialinsider 2026 Benchmarks Report)
10. Carousels are the #1 format on LinkedIn for the third consecutive year, which is the longest streak any single format has held since 2019. (Socialinsider 2026 Benchmarks Report)
| Format | 2026 avg. engagement rate | YoY change |
|---|---|---|
| Document carousels | 7.00% | +14% |
| Multi-image posts | 4.30% | +6% |
| Native video | 1.83% | -36% |
| Single image | 0.74% | -8% |
| Text-only post | 0.46% | -12% |
The reason carousels keep winning is structural. Every other format competes for attention in a single moment. Carousels create their own dwell time the second someone taps the first slide.
The 2026 algorithm: what now decides distribution
The 2026 LinkedIn algorithm reads engagement differently than the 2024 version did. Two of the biggest changes affect every carousel directly.
More engagement on posts with 61+ seconds of dwell time vs. posts with 0-3 seconds
Source: SocialBee Algorithm GuideWindow during which most distribution is decided after publishing
Source: Algorithm InSights, Richard van der BlomHigher chance someone follows you after saving one of your posts
Source: Meet-Lea Algorithm Report11. Posts with 61+ seconds of dwell time hit 15.6% engagement, vs. 1.2% for posts read for 0-3 seconds. That is a 13x difference, which is why every carousel best-practice now starts with "earn the swipe." (SocialBee)
12. Saves and sends now outrank likes as algorithmic signals. Fewer than 3% of LinkedIn posts get saved, but a single save raises the probability of a future follow by 130% according to Meet-Lea's analysis of the new algorithm. (Meet-Lea)
13. The first 90 minutes after publishing decide most of your reach. In 2024, that window was closer to four hours. The 2026 algorithm makes its distribution call faster, which is why posting at the wrong time now has a bigger downside than it used to. (Algorithm InSights, Richard van der Blom)
14. Comments carry roughly 15x the algorithmic weight of likes, but only when they exceed 12 words and stay on-topic. Short comments like "great post" are now down-weighted. (SourceGeek Algorithm Update)
15. Posting more than 3 times per week dilutes reach for most accounts. Above 3 posts per week, your own backlog starts competing with your new posts, and the algorithm caps how many of your posts hit the same follower's feed. (Algorithm InSights, Richard van der Blom)
16. LinkedIn rebuilt its ranking model on a system called 360Brew in early 2026. The new model weights credibility, dwell time, and meaningful engagement above raw reactions. Posts that pattern-match to generic AI prose are now down-ranked. (upGrowth Algorithm Update)
What this means for carousels: the algorithm rewards exactly what carousels do best. Long dwell time, save-worthy content, slow swiping. The new ranker is structurally biased toward the format.
Anatomy of a high-performing carousel
The optimal shape of a 2026 carousel is no longer a guess. The big benchmark studies converge on a clear set of numbers.
17. The optimal slide count is 7 to 10. This is the sweet spot for engagement and completion rate. Below 5 slides, dwell time stays too low to trigger distribution. Above 12, completion rate falls off a cliff. (Socialinsider via the size guide)
| Slide count | Avg. engagement rate | Completion rate |
|---|---|---|
| 3 to 5 slides | 4.2% | 78% |
| 7 to 10 slides | 6.8% | 65% |
| 11 to 15 slides | 5.9% | 48% |
| 16+ slides | 4.1% | 32% |
18. Once you exceed 15 slides, completion rate drops by 40%. 60% of readers abandon the carousel before the final slide, and the algorithm reads partial swipes as a weak signal. (Carouselli)
19. Strong carousels maintain a 60%+ completion rate. A 10-slide carousel with 65% completion outperforms a 20-slide carousel with 25% completion in every algorithm metric that matters. Quantity does not beat finishability. (usevisuals)
20. The 4:5 portrait ratio (1080x1350 px) takes up roughly 80% of a 6.1-inch mobile screen, vs. 65% for 1:1 square and 40% for 16:9 landscape. The taller the slide, the longer it stays in the viewport. The full export specs are in our LinkedIn carousel size guide. (SQ Magazine mobile data)
21. Approximately 70% of LinkedIn content consumption happens on mobile. Desktop still drives the bulk of professional actions like recruiting and outbound, but feed scrolling, where carousels live, is a mobile activity. Design for the small screen first. (SQ Magazine)
22. The 2026 hook formula is "specific promise, specific payoff." Hook slides that name a number, a case, or a framework outperform vague hooks by a wide margin in the latest van der Blom data. The era of "10 ChatGPT prompts that will change your life" is over.
B2B marketing and lead generation
If you are using LinkedIn for B2B, the carousel format is no longer optional. The conversion data makes that case on its own.
23. 89% of B2B marketers use LinkedIn for lead generation, and 62% say it produces leads. No other social platform comes close on B2B intent. (Cognism)
24. 75-85% of all B2B social media leads originate on LinkedIn. The platform is now the default top-of-funnel channel for B2B SaaS, agencies, and consulting firms. (Cognism)
25. LinkedIn Lead Gen Forms convert at 13% on average, more than 3x the typical landing page rate of 4.02%. Carousels are one of the most common formats used to drive traffic to those forms because they pre-qualify the audience by topic. (Martal)
What stops working in 2026
Two patterns that drove reach in 2024 are now actively penalized. Both reports flagged the same trends.
26. Carousels classified as "low-substance" lose roughly 35% of their reach. Generic listicles without specific data, hook slides that do not deliver on their promise, and engagement bait endings like "Agree?" or "Follow me for more" are the three biggest triggers. (Dataslayer)
27. Posts that pattern-match to generic AI prose are down-ranked by the 360Brew classifier. The category that performs best in 2026 is "human-edited AI content," meaning AI-drafted text rewritten with specific stories, numbers, or opinions only the author can provide. Pure raw AI output now correlates with measurable reach loss. (upGrowth)
The pattern is clear. The 2026 algorithm rewards specificity. Vague carousels lose reach, even if they used to win it. The good news: this is a tractable problem. You can fix specificity in 30 minutes per carousel without changing your brand, your design, or your posting cadence.
How to use these numbers
Three plays make sense given the 2026 data.
Move at least 50% of your LinkedIn output into the carousel format. If document carousels generate 7x more engagement than text-only posts and 9x more than static images, the format is not optional. The marginal cost of producing one more carousel is far lower than the marginal cost of competing for reach with a sub-1% engagement format.
Cut frequency. Concentrate quality. Two well-built carousels per week, each with one save-worthy slide, outperform five rushed posts. The algorithm now penalizes self-cannibalization above three posts per week, and the 90-minute distribution window means a poorly timed post mostly disappears.
Earn the swipe with a specific hook. Slide one names a number, a case, or a framework. Slides 2-7 each deliver one piece of that promise. Slide 8 to 10 wraps with one save-worthy element (a checklist, a comparison table, a numbered framework). That is the structural template that maps cleanly onto the 2026 algorithm signals.
How Carousels Generator helps
The 2026 reality is that you need carousels with specificity, fast. That is exactly what we built the tool around.
You write a prompt that contains the specifics only you have: your real numbers, a customer case, a framework you actually use. The AI produces the design and structure in under 60 seconds. You spend the saved time on what matters most for the algorithm: rewriting two or three slides in your own voice, sharpening the hook so it earns the rest of the swipes.
The free plan includes 10 credits and works without a credit card. Generate your first carousel in two minutes, then refine the slides where your insider knowledge actually lives. The algorithm will reward what you put in.
If you want to compare your current tool stack first, the 2026 carousel generator comparison tests seven options across speed, AI quality, and pricing.
Sources
- Socialinsider, 2026 LinkedIn Benchmarks Report (1.3M posts, 16,645 pages, Jan 2024 to Dec 2025)
- Richard van der Blom, Algorithm InSights 2025/2026 (1.8M posts, 58,000 profiles tracked over 12 months)
- Postunreel, LinkedIn Carousel Engagement Statistics 2026
- Dataslayer, LinkedIn Algorithm February 2026 Update
- DemandSage, 47 LinkedIn Statistics 2026
- Cognism, 100 Essential LinkedIn Statistics for 2026
- Martal, Conversion Rate Statistics 2026
- Marketing4eCommerce, Carousels Dominate LinkedIn
- usevisuals, LinkedIn Carousel Engagement Statistics 2026
- Carouselli, How Many Slides in a LinkedIn Carousel
- SocialBee, LinkedIn Algorithm Guide 2026
- Meet-Lea, LinkedIn Algorithm Explained 2026
- upGrowth, LinkedIn Algorithm 2026: 360Brew Update
- SourceGeek, How the LinkedIn Algorithm Works (2026 Update)
- DowSocial, LinkedIn Algorithm 2026: 7 Shifts B2B Marketers Need to Know
- SQ Magazine, LinkedIn Mobile vs. Desktop Statistics 2026
Ready to create carousels like a pro?
Stop spending hours on each LinkedIn post. Let AI handle the text and design for you.
Popular LinkedIn carousel templates
Reuse in one click on your own topic. AI rewrites the text, keeps the design.